14 markets · up to date with the market

Price any used car at its real market value.

Market price with a P10 · P50 · P90 range, a 6-year value projection and a PDF report, across 14 European countries. No subscription: buy a credit pack and value cars whenever you need to.

Packs from €14.99 incl. VAT · 1 credit = 1 valuation · never expire · 5 trial credits once you verify your email

A row of premium used cars on a dealer lot at night.
  • 14 countries
  • P10 · P50 · P90
  • 6 to 72-month projection
  • PDF report
  • JSON API
  • No subscription

How a car loses value, month by month.

Median curve from our residual-value grid for the same car, a Renault Clio hybrid, in Germany and in Spain, at 15,000 km a year. Every valuation gives you your own, for your version and your mileage.

See residual value 6-72
Renault Clio hybrid: residual value as % of new price, by term (Germany and Spain, 15,000 km/year)
40%50%60%70%80%90%6121824303642485460Term in months% of new priceGermany · 6: 87.4%Germany · 12: 80.5%Germany · 18: 75.2%Germany · 24: 70.6%Germany · 30: 66.6%Germany · 36: 62.9%Germany · 42: 59.5%Germany · 48: 56.4%Germany · 54: 53.4%Germany · 60: 50.4%Spain · 6: 76.7%Spain · 12: 76.3%Spain · 18: 71.9%Spain · 24: 69.0%Spain · 30: 64.9%Spain · 36: 61.8%Spain · 42: 58.5%Spain · 48: 55.5%Spain · 54: 52.6%Spain · 60: 49.7%Germany 50.4%Spain 49.7%

Source: ARST Data residual-value grid, median across versions, 19 Oct 2026.

Who it's for

Who each number works for.

An analyst reviews a printed report next to a laptop showing charts.

Leasing and rental

400 returns are coming in this quarter.

Say you run a fleet of 3,000 cars. Before you price each returned car you want to know whether the residual you signed still holds against today's market. You load the list and, car by car, you see its market value with its interval and the curve up to 72 months.

Use case, not a real client. The figures for each car come from the engine.
Everything in your account.

From a single car to the whole portfolio, with the same valuation behind it. The images are real outputs from the tool.

  1. 1 car

    Value one car, or compare two

    Make, model, year and mileage: today's value with its likely range and the curve out to 72 months. The comparison puts two cars side by side. One credit each.

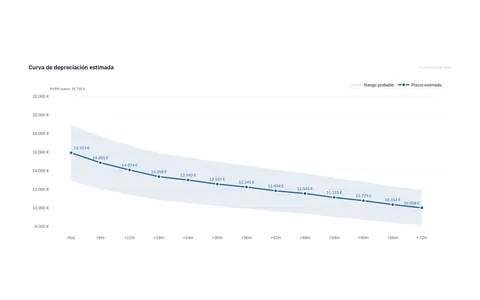
    Residual value 6-72
    Residual value curve of a valuation, from today to 72 months, with its likely range.
  2. Every valuation

    PDF report, history and a link to share

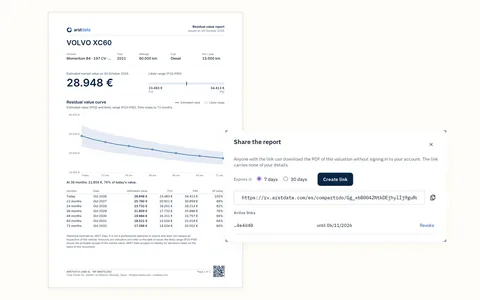
    Everything you value stays in your history. Opening it again or downloading the PDF uses no credits, and you can share the report through a link that expires after 7 or 30 days, without giving access to your account.

    PDF report of a valuation and the window that creates a link to share it.
  3. 14 countries

    The same car, in 14 markets

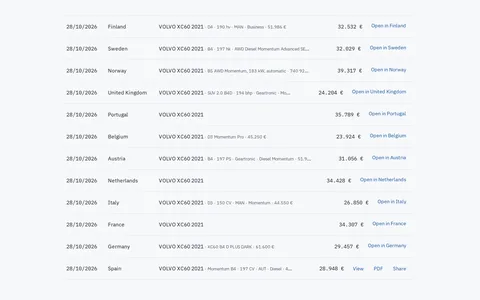
    Each country with its own currency and versions. Your history brings valuations from every market into one list.

    History with the same model valued in several European countries.
  4. Up to 200 cars

    Excel batch

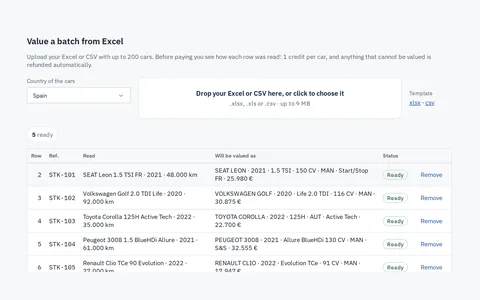
    Upload your Excel or CSV. Before you pay, you see how each row was read and how it will be valued. One credit per car; anything that cannot be valued is refunded automatically. Results come as Excel and PDF.

    Batch preview: each Excel row with the car it will be valued as.
  5. Your portfolio

    Portfolio monitor

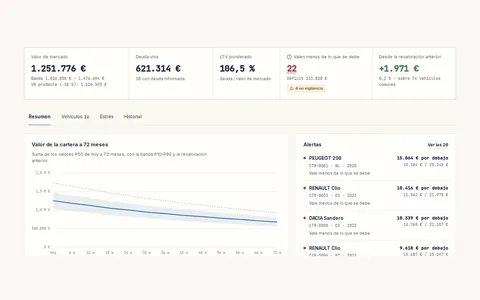
    Your book revalued: value against debt, alerts and stress scenarios.

    See the monitor
    Monitor dashboard with a test portfolio's value against its debt.
  6. Your market

    Market report

    Prices, turnover, electric cars and Chinese brands in your country, in a PDF report.

    See the report
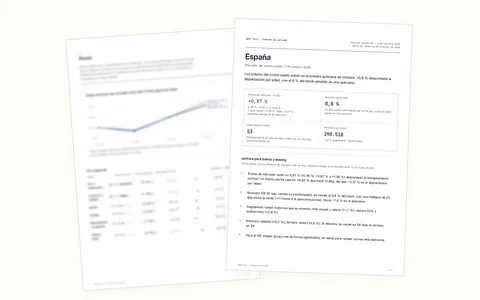
    Two pages of the market report.
  7. Your system

    API with a test key

    The same valuations inside your own system. With the test key you integrate without spending credits: sample data in the real format, up to 50 calls a day.

    See the API
    curl -X POST \
      rv.arstdata.com/api/v1/valuation \
      -H 'Authorization: Bearer sk_test_…' \
      -d '{"country": "ES", "brand": "SEAT",
           "model": "LEON", "year": 2021,
           "km": 48000, "fuel": "petrol"}'
    
    { "currency": "EUR",
      "p10": …, "p50": …, "p90": …,
      "horizons": { "0": {…}, …, "72": {…} },
      "sandbox": true }
    Test key response (sample data)
Aerial view of a car yard with hundreds of cars parked in rows.

One engine, across 14 markets.

When you ask for a valuation, your number is ready straight away, with its interval, in any of the countries in service.

  1. Our own market dataAggregated and validated, across 14 countries.
  2. Consistent catalogueMake, model and trim carry the same name in every country.
  3. Every car, by its trimEstimated value by make, model, trim and year.
  4. Your number, when you askP10 · P50 · P90 on the web, as a PDF and over the API.
3percentiles on every valuation: P10 · P50 · P90
1 creditper valuation, no subscription
14European markets
72 monthsof residual-value curve

The data we work with.

Our own aggregated, validated market data, plus public macroeconomic indicators.

Market · 14 countries

  • Our own market data
  • Aggregated and validated
  • Reference new price by trim and year
  • No personal data

Macro · public indicators

  • Interest rates
  • Inflation
  • Economic activity

Valuations with the recent market in each country.

Dome of the Metrópolis building on Calle de Alcalá, Madrid, against a blue sky.
Metrópolis building, Madrid. Photo: GFreihalter · CC BY-SA 3.0

Who is behind it.

We are a Madrid company with our own valuation engine for the European used-car market. Each country's accuracy is available on request for professional clients.

Accuracy by countryTalk to us

Would rather talk to someone before signing up?

info@arstdata.com
Go to the contact form →